Do look-alike news audiences click on the same advertisement?
11 August 2022

Photo by Amir-abbas Abdolali, Unsplash
This standalone project was undertaken during my summer 2022 internship at The Washington Post. The primary objective of the study was to identify potential audiences with a higher propensity to engage with specific advertisements using lookalike modeling techniques
Project Background & Purpose
Digital news platforms function as intermediaries, bridging the gap between advertisements and their target audiences to promote products or services. This interaction involves three pivotal stakeholders:
- Audiences: These individuals exhibit varied responses to online advertisements based on a range of factors, including their personal interests, predisposition, access times, locations, and the devices they use.
- Advertisers: Their primary goal is to present their advertisements to users deemed valuable for their respective marketing strategies.
- News platform: This entity acts as the service provider.
While the news platform captures audiences’ clickstream data, detailing which advertisements have been engaged with, predicting future engagement remains challenging. This issue extends beyond merely determining whether an audience will click on an advertisement; it evolves into a nuanced “click or unlabeled” problem. This is because the absence of a click (negative instances) doesn’t conclusively signify disinterest. In reality, such instances could represent either genuine disinterest or potential interest.
Within the scope of this research, I devised a lookalike modeling approach with three primary objectives:
- To effectively address the positive-or-unlabeled problem.
- To enhance the precision in identifying potential audiences from the unlabeled group, who are more likely to engage with a specific advertisement.
- To augment the advertisers’ audience reach, thereby amplifying the breadth of their campaigns.
A foundational premise of lookalike modeling is the belief that potential audiences, likely receptive to advertisements, exhibit traits mirroring those of existing users who have already engaged with the advertisement.
Lookalike Modeling
Lookalike modeling is commonly used to identify new potential users and expand audience base. The basic idea is pretty simple: given a seed set \(S\) from a universal set \(U\), find groups of audiences from \(U-S\) who look and act like the audiences in \(S\). Lookalike modeling can be addressed from the three different methodological approaches: rule-based, similarity-based, and model-based.
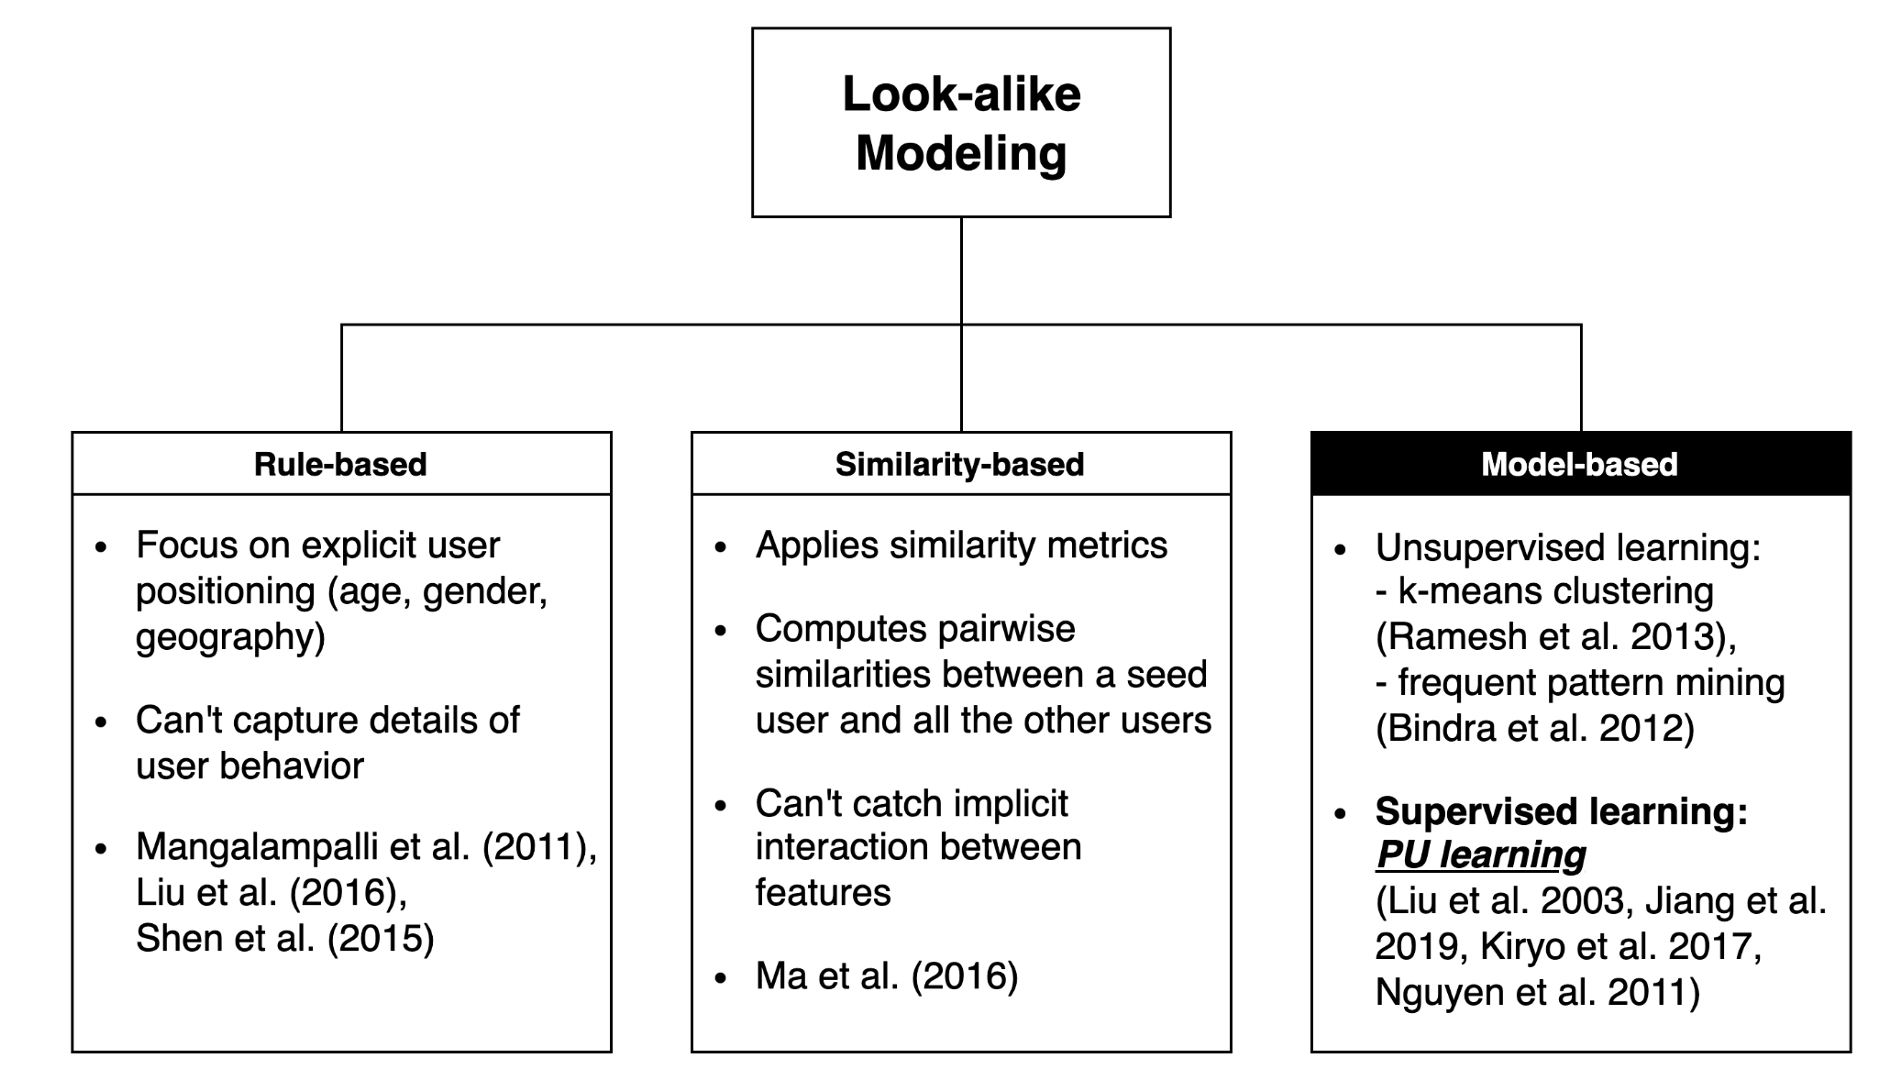
In this project, I adopted a model-based approach, specifically Positive-Unlabeled (PU) learning, which proceeds as follows:
Given a training set containing only positives (\(P\)) and unknown (\(U\)) classes:
- Treating all \(U\) as negatives (\(N\)), train a classifier \(P\) vs. \(U\)
- Using the classifier, score the unknown class and isolate the set of ‘reliable’ negatives (\(RN\))
- Train a new classifier on \(P\) vs. \(RN\), use it to score the remaining U, isolate additional \(RN\) and enlarge \(RN\)
- Repeat Step 3 until no new negative cases are classified
While the process may seem straightforward on the surface, two central challenges must be addressed prior to implementing PU learning. The initial challenge pertains to sampling. Specifically, one must determine the optimal probability threshold for reliable negative (RN) instances. Furthermore, it is crucial to identify which sampling method is superior in both efficiency and effectiveness. The subsequent challenge relates to prediction, posing the question: Which predictive model yields the most favorable outcomes? Given the diverse sampling and prediction techniques available, and the potential combinations therein, a plethora of PU learning designs can be conceptualized.
Research Framework
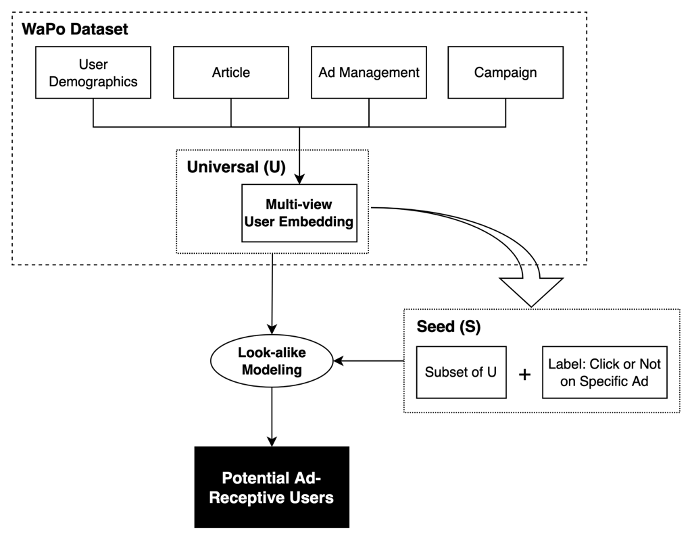
- Stage 1: Identify seed audiences from the news platform user data (The seed audiences are ad-receptive users who have once clicked on a specific ad)
- Stage 2: Conduct look-alike modeling on the seed set and find potential audiences
Data
To make the experiment simple, I used a specific advertisement which has been clicked 294 times out of 30,463 impressions. Therefore, there are 294 positive cases (\(S\)) and 30,463 unlabeled cases (\(U-S\)). After collecting the ad-related dataset such as the number of articles read by topic, clicking propensity, advertisement size and position, the number of line item, the number of impressions on a specific user, user device info, and user demographic info, I categorized them into three levels: article-level, ad-level, and user-level. The time period covered by the dataset is as below.
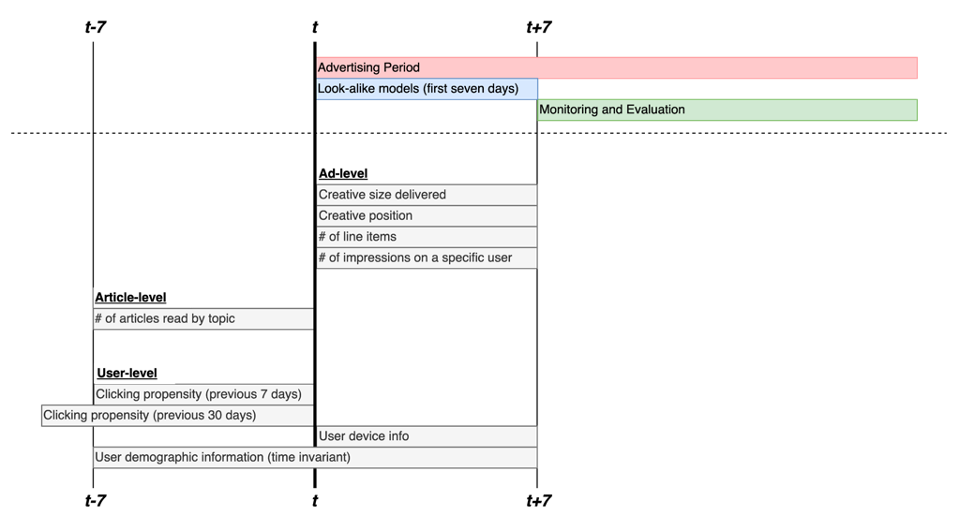
The first seven days of the whole advertising period were used for training and testing the look-alike modeling, and the remaining period was used for monitoring and evaluation.
Method
- Sampling: Spy sampling and bootstrapping sampling
- Prediction: Logistic regression and AdaBoost
Spy Sampling (Liu et al. 2002)
Input: Positive Sample Set \(P\), unlabeled Sample Set \(U\)
Output: Negative Sample Set \(N\) with size \(k\)
- Randomly select a subset from \(P\) as the spy set \(P'\);
- Train a classifier \(M\) based on \(P-P'\) and \(U+P'\);
- Select a subset \(N\) of \(k\) samples from \(U\) with least prediction scores;
- Return \(N\);
The key idea of the Spy sampling is that the spies behave identically to the unknown positive users in \(U\).
Bootstrap (Boosting) Sampling (Mordelet and Vert 2014, Zhao et al. 2022)
Input: Positive Sample Set \(P\), unlabeled Sample Set \(U\)
Output: Negative Sample Set \(N\) with size \(k\)
- For \(t \leq T\) do
Bootstrap a subset \(U'\) from \(U\);
Train a classifier \(M\) on \(P\) and \(U'\);
Predict \(U-U'\) using classifier \(M\);
Record the classifying scores; - Average the classifying scores of all iterations;
- Select a subset \(N\) of \(k\) samples with least average scores;
- Return \(N\);
In addition, since the dataset has very small number of positive cases (less than 0.01\%), SMOTE and SMOTE+RUS methods were applied to the training set.
- SMOTE (Synthetic Minority Oversampling Technique): upsampled minority (positive) to make the ratio of positive to unlabeled cases 1 to 1 (Chawla et al. 2002)
- SMOTE + RUS (Random Under Sampler): combined SMOTE with random undersampling of the majority to make the ratio 1 (positive) to 2 (unlabeled). This combined technique is also suggested in Chawla et al (2002). Also check this online article for more detailed use cases of both methods.
Results & Evaluation
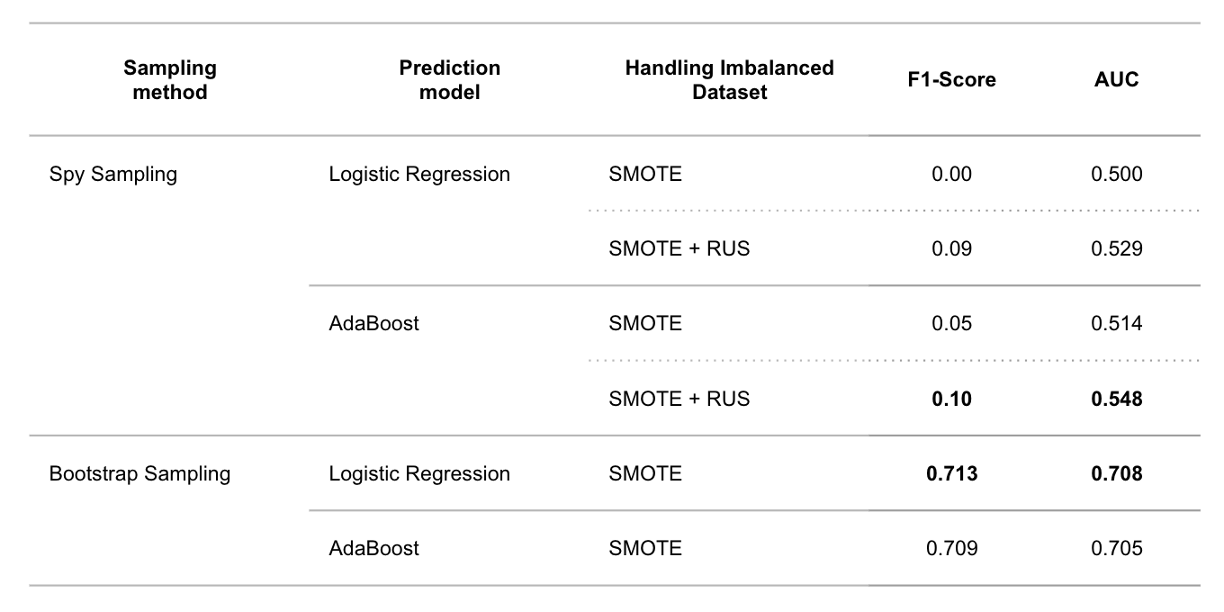
The models based on bootstrap sampling show a better performance on test set than the models with spy sampling.
During the monitoring and evaluation period, users identified by the Spy+AdaBoost (AB) and Spy+Logistic Regression (LR) models exhibited a higher propensity to click on the advertisements compared to users selected at random.
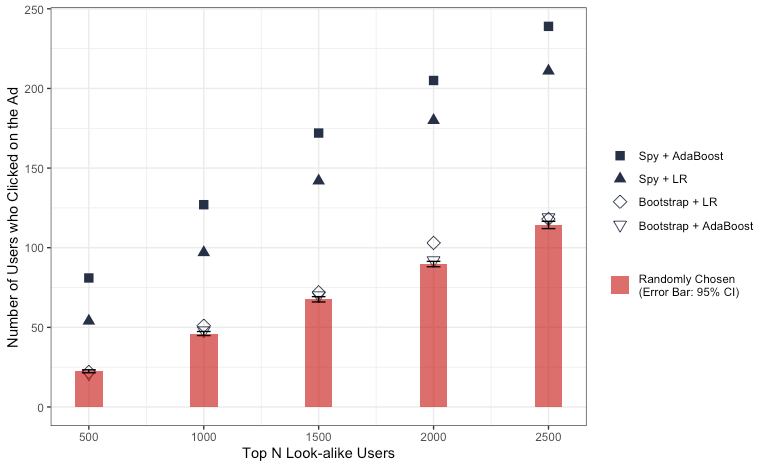
- Users ranked by the Bootstrap+LR and Bootstrap+AB models demonstrated a clicking tendency that was either marginally higher or nearly equivalent to that of users chosen randomly.
- Although the Spy+LR and Spy+AB look-alike models underperformed on the test set relative to the bootstrap sampling models, they yielded a more precise list of users.
Also, as shown in the figure below, the Spy+AB and Spy+LR models identified users who clicked on the advertisement more rapidly than other models.
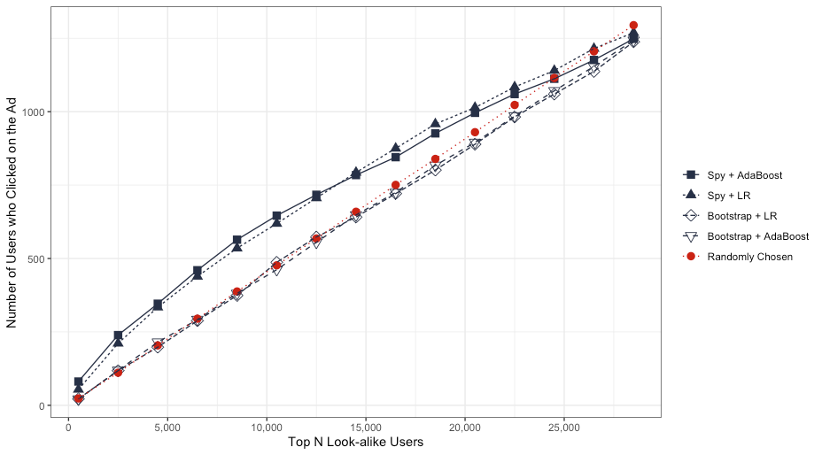
- As the number of top N look-alike users increases, the disparity between the models widens. However, this gap eventually narrows and converges upon reaching the peak count of positive cases.
Limitations & Challenges
- Ad-Specificity: The models we developed are tailored to a particular advertisement. As such, the efficacy of these models can vary considerably based on the selected advertisement.
- Information Loss: The user data incorporated into our models is sourced from multiple datasets. This integration led to a substantial loss of information due to missing values associated with numerous users.
- Limited Positive Cases: The aforementioned information loss resulted in a dataset with a stark scarcity of positive cases. For our training purposes, we only had access to 294 such cases, resulting in a pronounced data imbalance.
- Memory Constraints: The consolidated dataset originally comprised millions of observations (impressions) and spanned thousands of features. Consequently, this demanded significant memory capacity and extended periods for both data collection and model training.